
RBC, WBC and Platelet Histograms: How to Read Them
Every impedance analyser prints three size curves beside the numbers. What a normal curve looks like, what the common abnormal shapes point to, and when a curve tells you not to trust the count.
What a histogram shows
Each cell that crosses the counting aperture makes a pulse whose height matches its volume. The analyser sorts the pulses by size and draws the result: cell volume in femtolitres (fL) along the bottom, the relative number of cells up the side. A normal histogram starts and ends on the baseline. MCV and RDW are calculated from the red-cell curve and MPV and PDW from the platelet curve, so a misshapen curve means those numbers need checking too.
| Curve | Counted between | Values calculated from it |
|---|---|---|
| Platelets | 4 fL and a floating discriminator between 15 and 30 fL | PLT, MPV, PDW and P-LCR (the share of platelets larger than 12 fL) |
| Red cells | The platelet discriminator and 250 fL | RBC, MCV, RDW; HCT is then RBC × MCV |
| White cells (after lysis) | 45 to 600 fL | WBC and the 3-part differential |
Read next How the pulses are made
Reading the RBC histogram
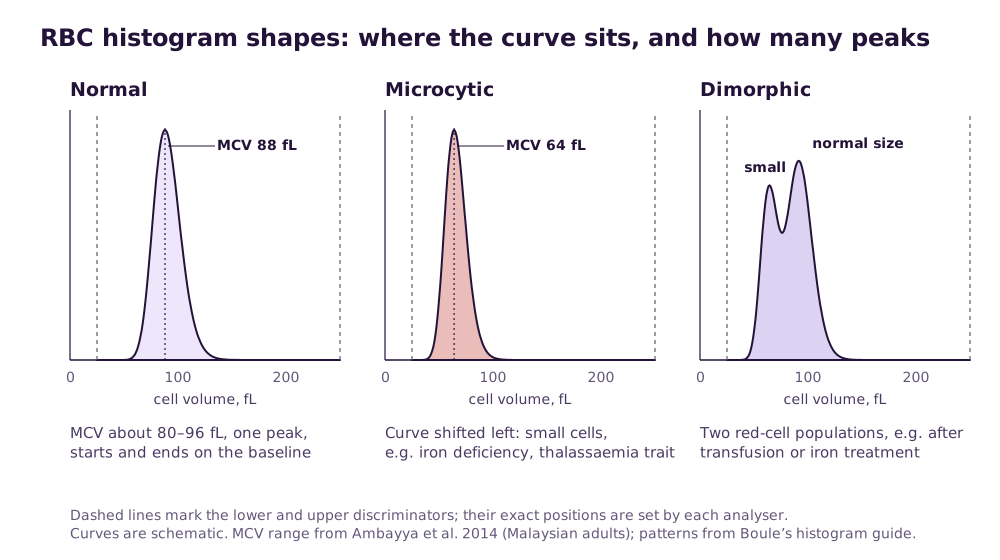
In healthy Malaysian adults the MCV reference interval is 80.6–95.5 fL, RDW-CV 12.0–14.8% and RDW-SD 37.5–48.1 fL (Ambayya et al., 2014). The peak of a normal red-cell curve sits in that MCV range, and its width matches the RDW.
| Shape | What you see | Common causes | Next step |
|---|---|---|---|
| Normal | One symmetrical peak inside the discriminators | Healthy red cells | None |
| Shifted left (microcytic) | Peak below the normal range; MCV low | Iron deficiency, thalassaemia trait | Check MCH and RBC count; consider iron studies and thalassaemia screening |
| Shifted right (macrocytic) | Peak above the normal range; MCV high | B12 or folate deficiency, liver disease, alcohol; falsely, red-cell agglutination | Film; warm the sample if agglutination is suspected |
| Broad curve | Wide base; RDW high | Mixed cell sizes, as in early iron deficiency | Film for variation in size |
| Two peaks (dimorphic) | Two populations of different size | Recovery from iron deficiency, combined iron and B12 or folate deficiency, recent transfusion | Check the history; film |
| Raised at the lower discriminator | Curve does not start on the baseline | Red- or white-cell fragments, giant platelets, very small red cells, platelet clumps | Film; RBC and PLT counts may both be wrong |
| Raised at the upper discriminator | Curve does not return to the baseline | Red-cell agglutination or cold agglutinins, nucleated red cells, small lymphocytes in CLL | Warm to 37 °C for 15 minutes and rerun; film |
Read next Thalassaemia screening on the FBCFBC normal ranges
Reading the platelet histogram
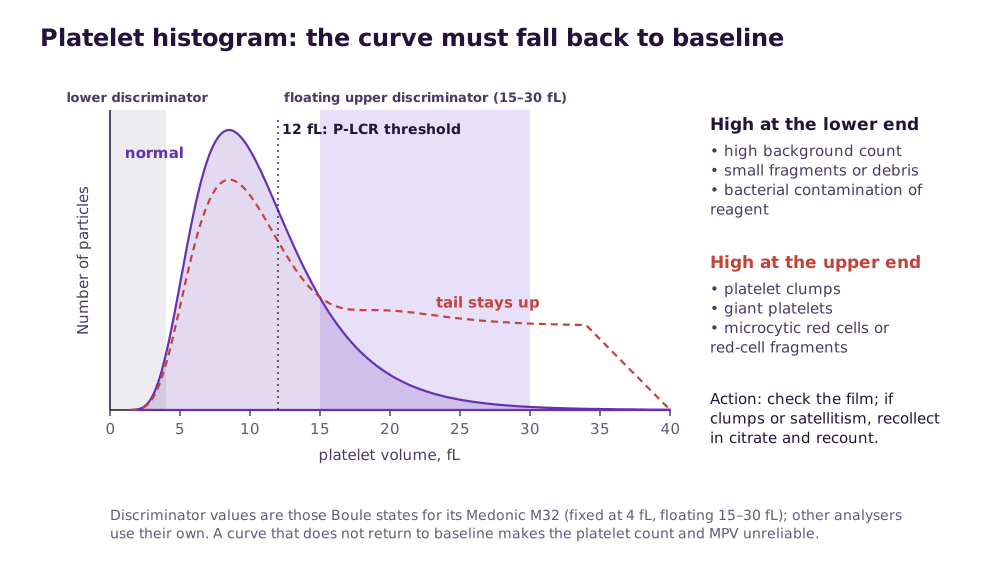
A normal platelet curve rises steeply, peaks well below 15 fL and slopes back to the baseline before the upper discriminator. Because large platelets and small red cells overlap in size, many analysers place the upper platelet discriminator at the lowest point between the two curves. Boule’s M32, for example, floats it between 15 and 30 fL so microcytic red cells are not counted as platelets.
Raised at the lower end
A high background count, debris or small fragments, platelet aggregation, or bacterial contamination of the reagent. Check the background count, rinse and rerun; if many samples show it, suspect the reagent.
Raised at the upper end
Giant platelets, platelet clumps, microcytic red cells or red-cell fragments. Check a film. If platelets are clumped or ringed around white cells (satellitism), recollect in citrate and recount.
Platelet clumping step by stepTwo platelet peaks
Recovery from chemotherapy, clumping or marked variation in platelet size. MPV, PDW and P-LCR are then unreliable.
Reading the 3-part WBC histogram
In the white-cell channel the lyse reagent destroys red cells and shrinks each white cell to a size typical of its type. Lymphocytes form the left-hand peak and granulocytes, mostly neutrophils, the larger right-hand peak. The smaller middle zone, MID, holds mainly monocytes along with eosinophils and basophils. Floating discriminators find the dips between the peaks.
Raised at the lower discriminator
Platelet clumps or giant platelets, nucleated red cells, lyse-resistant red cells or cryoglobulins are being counted as small white cells. The WBC may be falsely high.
Raised at the upper discriminator
Severe neutrophilia or extreme leukocytosis (over 100 × 10⁹/L). Dilute the sample, recount, and check the differential by microscopy.
No clear dip between populations
Blasts or other abnormal cells that fit no group. Do not report the differential until a film has been reviewed.
Old sample
Neutrophils shrivel on standing and drift into the MID zone while red cells swell. Boule states its M32 needs samples under 8 hours old for a correct differential.
Read next Analyser flags explained3-part vs 5-part
Three patterns you will see most often in a Malaysian clinic
Histograms are most useful read together with the indices. These three combinations come up again and again, and each points to a different next step.
Narrow, left-shifted curve with a high red-cell count
Small red cells that are all much the same size: low MCV and MCH, a normal or only slightly raised RDW, and a red-cell count at or above the top of the range. This pattern favours thalassaemia trait over iron deficiency, and the Mentzer index (MCV ÷ RBC) is often below 13. It is a reason to screen, not a diagnosis.
Thalassaemia screeningBroad, left-shifted curve with a high RDW
Small red cells of very mixed size: low MCV, a raised RDW and often a low red-cell count. This is the usual picture of iron deficiency. Iron studies, not a repeat FBC, are the next step.
A second peak appearing after treatment
A patient on iron treatment starts making normal-sized red cells while the small ones are still circulating, so a second peak grows on the right of the curve. The same shape after a transfusion reflects donor cells. Read it with the history before calling it abnormal.
What is optimal: a reading routine that takes ten seconds
- Look at the curves before the numbers on every result, not only flagged ones.
- Check that each curve starts and ends on the baseline.
- Compare the red-cell peak with the MCV and the curve’s width with the RDW; they should agree.
- For a low platelet count, look at the upper end of the platelet curve before believing it.
- For a high WBC, look at the lower end of the WBC curve for clumps or nucleated red cells.
- Compare with the patient’s previous histogram where you have one.
- Make a blood film whenever a curve is abnormal and your review rules say so. Many laboratories adapt the ISLH consensus criteria for this.
Read next Blood film review and the ISLH rules
Related guides
Hematology Analyser supply near you
Written quotes for clinics across Malaysia, handled from Batu Caves, Kota Kinabalu and Kuching.
- Hematology Analyser Kuala LumpurKuala Lumpur
- Hematology Analyser SelangorSelangor
- Hematology Analyser Petaling JayaSelangor
- Hematology Analyser Shah AlamSelangor
- Hematology Analyser KlangSelangor
- Hematology Analyser SerembanNegeri Sembilan
- Hematology Analyser MelakaMelaka
- Hematology Analyser Johor BahruJohor
Sources and further reading
- Boule Diagnostics. Understanding histograms: Medonic M32 white paper
- Daves M, et al. Modern hematology analyzers: beyond the simple blood cells count (with focus on the red blood cells). J Lab Precis Med, 2024
- Ambayya A, et al. Haematological reference intervals in a multiethnic population. PLoS ONE, 2014
- Barnes PW, et al. The international consensus group for hematology review: suggested criteria for action following automated CBC and WBC differential analysis. Lab Hematol, 2005
Frequently asked questions
What does a dimorphic RBC histogram mean?
What is the lower discriminator on an RBC histogram?
Why does my platelet histogram not return to the baseline?
Can a histogram replace a blood film?
Which FBC values come from the RBC histogram?
Get a written quotation
Tell us your clinic or lab type, daily workload and location. We match suitable models and send a written quotation that states who handles delivery, installation and training, and what each costs.
010-905 2891 · Mon–Sat, 9:00 am – 6:00 pm